Abstract
Hybrid work has become a durable feature of post-pandemic labor markets, yet its productivity implications remain contested. This study examines the association between work-from-home (WFH) intensity and U.S. nonfarm business labor productivity using public data from WFH Research and the Federal Reserve Economic Data database. Monthly WFH rates are aggregated to quarterly means and combined with quarterly productivity, real gross domestic product, and unemployment data for 2019-2026. The analysis applies descriptive statistics, correlation analysis, ordinary least squares models with heteroskedasticity- and autocorrelation-consistent standard errors, and a post-stabilization subsample beginning in 2022Q1. The WFH share rose from 7.15% of paid working days in December 2019 to 61.64% in May 2020 and then stabilized at 25.98% in June 2026. Over the broad study period, the productivity index increased by 13.64%. The full-sample change model shows no statistically significant independent WFH association, whereas the post-stabilization model reports a positive coefficient for quarterly WFH changes (0.119; p=0.028 using HAC normal inference). Because the sample is small and aggregate data contain structural shocks, the results are associational rather than causal. The evidence supports a contingent view in which productivity depends on task type, coordination design, digital infrastructure, autonomy, commute savings, and retention.
Keywords
Flexible Work Arrangements, Organizational Design, Coordination Costs, Employee Retention, Digital Infrastructure,
Labor-Market Adjustment
1. Introduction
The organization of work has undergone a major labor-market transformation. Before 2020, home-based work was concentrated in a limited group of occupations. The COVID-19 pandemic forced firms and workers to test remote arrangements at scale, and subsequent evidence shows that a substantial WFH share persisted after emergency restrictions ended
| [1] | Barrero, J. M., Bloom, N., Davis, S. J. The Evolution of Work from Home. Journal of Economic Perspectives. 2023, 37(4),
23-50. https://doi.org/10.1257/jep.37.4.23 |
| [2] | Bick, A., Blandin, A., Mertens, K. Work from Home Before and After the COVID-19 Outbreak. American Economic Journal: Macroeconomics. 2023, 15(4), 1-39.
https://doi.org/10.1257/mac.20210061 |
| [3] | WFH Research. Survey of Working Arrangements and Attitudes: Data. Available from:
https://wfhresearch.com/ (accessed 4 August 2026). |
| [4] | Aksoy, C. G., Barrero, J. M., Bloom, N., Davis, S. J., Dolls, M., Zarate, P. Working from Home Around the World. NBER Working Paper No. 30446. 2022.
https://doi.org/10.3386/w30446 |
[1-4]
. The central post-pandemic question is therefore not whether work can be performed outside the office, but whether hybrid arrangements can be designed to improve productivity without weakening collaboration and learning.
Hybrid work has theoretically opposing effects. It can increase uninterrupted focus, reduce commuting losses, improve schedule autonomy, widen recruitment pools, and strengthen job satisfaction. It can also raise coordination costs, weaken informal knowledge transfer, create isolation, and make performance assessment more difficult. Reviews and work-design studies therefore reject a universal productivity claim and emphasize job, worker, and organizational contingencies
| [5] | Allen, T. D., Golden, T. D., Shockley, K. M. How Effective Is Telecommuting? Assessing the Status of Our Scientific Findings. Psychological Science in the Public Interest. 2015, 16(2), 40-68. https://doi.org/10.1177/1529100615593273 |
| [6] | Gajendran, R. S., Harrison, D. A. The Good, the Bad, and the Unknown About Telecommuting: Meta-Analysis of Psychological Mediators and Individual Consequences. Journal of Applied Psychology. 2007, 92(6), 1524-1541.
https://doi.org/10.1037/0021-9010.92.6.1524 |
| [7] | Wang, B., Liu, Y., Qian, J., Parker, S. K. Achieving Effective Remote Working During the COVID-19 Pandemic: A Work Design Perspective. Applied Psychology. 2021, 70(1), 16-59. https://doi.org/10.1111/apps.12290 |
| [8] | Yang, L., Holtz, D., Jaffe, S., Suri, S., Sinha, S., Weston, J., Joyce, C., Shah, N., Sherman, K., Hecht, B., Teevan, J. The Effects of Remote Work on Collaboration Among Information Workers. Nature Human Behaviour. 2022, 6, 43-54.
https://doi.org/10.1038/s41562-021-01196-4 |
[5-8]
.
This paper studies the association between hybrid-work intensity and aggregate U.S. labor productivity. It combines WFH Research estimates of the percentage of paid working days performed from home with FRED measures of nonfarm business labor productivity, real GDP, and unemployment. Aggregate productivity is affected by sectoral composition, technology, capital deepening, labor reallocation, and business-cycle conditions. Accordingly, the empirical models are treated as exploratory associations, not causal estimates.
The management problem is practical. Uniform return-to-office mandates may ignore differences in task interdependence, while unrestricted flexibility may fail when firms do not redesign meetings, documentation, decision rights, and mentoring. The paper argues that productivity depends less on a fixed number of office days than on the alignment of task requirements, managerial coordination, digital systems, employee autonomy, and output measurement.
1.1. Research Objectives and Questions
1) Document the persistence of WFH in the United States after the emergency-pandemic period.
2) Examine changes in U.S. nonfarm business labor productivity during the same period.
3) Estimate exploratory associations between quarterly WFH intensity and productivity growth after controlling for GDP growth and unemployment.
4) Integrate aggregate evidence with experimental, occupational, and organizational research.
5) Derive managerial and policy principles for designing productive hybrid-work systems.
Research Questions
1) How persistent is WFH in the post-COVID U.S. labor market?
2) How did nonfarm business labor productivity evolve as WFH moved from an emergency peak to a stabilized level?
3) Is quarterly WFH intensity associated with productivity growth after macroeconomic controls are included?
4) Which mechanisms and boundary conditions explain positive and negative productivity outcomes?
5) Which managerial and policy practices can convert flexibility into a sustainable productivity system?
1.2. Research Gaps and Contributions
First, much of the early literature examined emergency remote work under lockdowns, school closures, health risks, and unusual demand shocks. Designed hybrid work is institutionally different because firms and workers have had time to invest in equipment, routines, and policy. Second, organizational research often relies on self-reported performance, whereas economic research uses aggregate productivity measures that do not capture organizational mechanisms or commuting benefits. Third, causal firm-level findings are difficult to translate into national policy because the feasibility of WFH differs across occupations and sectors
| [8] | Yang, L., Holtz, D., Jaffe, S., Suri, S., Sinha, S., Weston, J., Joyce, C., Shah, N., Sherman, K., Hecht, B., Teevan, J. The Effects of Remote Work on Collaboration Among Information Workers. Nature Human Behaviour. 2022, 6, 43-54.
https://doi.org/10.1038/s41562-021-01196-4 |
| [9] | Dingel, J. I., Neiman, B. How Many Jobs Can Be Done at Home? Journal of Public Economics. 2020, 189, 104235. https://doi.org/10.1016/j.jpubeco.2020.104235 |
| [10] | Choudhury, P., Foroughi, C., Larson, B. Work-from-Anywhere: The Productivity Effects of Geographic Flexibility. Strategic Management Journal. 2021, 42(4), 655-683.
https://doi.org/10.1002/smj.3251 |
[8-10]
.
A further gap concerns interpretation. A positive productivity trend after 2020 does not prove that hybrid work caused the increase. Conversely, a negative correlation between WFH levels and a rising productivity index may simply reflect the decline from emergency WFH levels. The present study separates descriptive persistence, statistical association, and causal interpretation to reduce this risk of overstatement.
Study Contributions
1) Empirical: constructs a reproducible quarterly dataset linking WFH intensity with U.S. productivity, GDP, and unemployment.
2) Theoretical: integrates socio-technical systems, job demands-resources, coordination-cost, and retention mechanisms.
3) Methodological: distinguishes full-sample pandemic dynamics from the post-stabilization period and reports HAC inference.
4) Managerial: identifies task segmentation, collaboration windows, documentation, manager capability, and output-based evaluation as design levers.
5) Policy: connects hybrid work with labor-force access, transport, digital capability, disability inclusion, and regional labor-market matching.
2. Literature Review
2.1. Evolution of Telework and Hybrid-Work Research
Telework research developed through three stages. Pre-pandemic studies treated home working as an optional arrangement for selected employees. Meta-analytic evidence associated telecommuting with autonomy and job satisfaction while warning that effects depend on intensity and relational quality
| [5] | Allen, T. D., Golden, T. D., Shockley, K. M. How Effective Is Telecommuting? Assessing the Status of Our Scientific Findings. Psychological Science in the Public Interest. 2015, 16(2), 40-68. https://doi.org/10.1177/1529100615593273 |
| [6] | Gajendran, R. S., Harrison, D. A. The Good, the Bad, and the Unknown About Telecommuting: Meta-Analysis of Psychological Mediators and Individual Consequences. Journal of Applied Psychology. 2007, 92(6), 1524-1541.
https://doi.org/10.1037/0021-9010.92.6.1524 |
[5, 6]
. During the emergency stage, researchers focused on sudden remote work, work-design problems, and the unequal occupational capacity to work from home
| [7] | Wang, B., Liu, Y., Qian, J., Parker, S. K. Achieving Effective Remote Working During the COVID-19 Pandemic: A Work Design Perspective. Applied Psychology. 2021, 70(1), 16-59. https://doi.org/10.1111/apps.12290 |
| [9] | Dingel, J. I., Neiman, B. How Many Jobs Can Be Done at Home? Journal of Public Economics. 2020, 189, 104235. https://doi.org/10.1016/j.jpubeco.2020.104235 |
[7, 9]
. The post-pandemic stage examines hybrid work as a durable equilibrium rather than a temporary crisis response
| [1] | Barrero, J. M., Bloom, N., Davis, S. J. The Evolution of Work from Home. Journal of Economic Perspectives. 2023, 37(4),
23-50. https://doi.org/10.1257/jep.37.4.23 |
| [2] | Bick, A., Blandin, A., Mertens, K. Work from Home Before and After the COVID-19 Outbreak. American Economic Journal: Macroeconomics. 2023, 15(4), 1-39.
https://doi.org/10.1257/mac.20210061 |
| [3] | WFH Research. Survey of Working Arrangements and Attitudes: Data. Available from:
https://wfhresearch.com/ (accessed 4 August 2026). |
| [4] | Aksoy, C. G., Barrero, J. M., Bloom, N., Davis, S. J., Dolls, M., Zarate, P. Working from Home Around the World. NBER Working Paper No. 30446. 2022.
https://doi.org/10.3386/w30446 |
[1-4]
.
Experimental evidence shows why context matters. A structured call-center experiment found higher performance among home-based employees, but the setting involved measurable individual tasks
| [11] | Bloom, N., Liang, J., Roberts, J., Ying, Z. J. Does Working from Home Work? Evidence from a Chinese Experiment. Quarterly Journal of Economics. 2015, 130(1), 165-218. https://doi.org/10.1093/qje/qju032 |
[11]
. A later randomized trial involving 1,612 employees found that a structured hybrid schedule reduced quit rates by approximately one-third without damaging performance grades
. These findings support hybrid work when arrangements are deliberate, measurable, and supported by management.
Evidence from information-intensive work is more mixed. Remote work can preserve or improve individual output while changing collaboration networks and reducing cross-team communication. Research on Microsoft information workers identified more static and siloed collaboration patterns under remote work
| [8] | Yang, L., Holtz, D., Jaffe, S., Suri, S., Sinha, S., Weston, J., Joyce, C., Shah, N., Sherman, K., Hecht, B., Teevan, J. The Effects of Remote Work on Collaboration Among Information Workers. Nature Human Behaviour. 2022, 6, 43-54.
https://doi.org/10.1038/s41562-021-01196-4 |
[8]
. Software-development evidence also shows that productivity effects depend on the metric, project type, and coordination needs
| [13] | Bao, L., Li, T., Xia, X., Zhu, K., Li, H., Yang, X. How Does Working from Home Affect Developer Productivity? A Case Study of Baidu During the COVID-19 Pandemic. Empirical Software Engineering. 2022, 27, Article 17.
https://doi.org/10.1007/s10664-021-10115-y |
[13]
. Geographic flexibility may improve output where work is digitally portable and worker-task matching improves
| [10] | Choudhury, P., Foroughi, C., Larson, B. Work-from-Anywhere: The Productivity Effects of Geographic Flexibility. Strategic Management Journal. 2021, 42(4), 655-683.
https://doi.org/10.1002/smj.3251 |
[10]
.
2.2. Empirical Evidence and Boundary Conditions
1) Persistence: WFH remains well above pre-pandemic levels in U.S. and international evidence
| [1] | Barrero, J. M., Bloom, N., Davis, S. J. The Evolution of Work from Home. Journal of Economic Perspectives. 2023, 37(4),
23-50. https://doi.org/10.1257/jep.37.4.23 |
| [2] | Bick, A., Blandin, A., Mertens, K. Work from Home Before and After the COVID-19 Outbreak. American Economic Journal: Macroeconomics. 2023, 15(4), 1-39.
https://doi.org/10.1257/mac.20210061 |
| [3] | WFH Research. Survey of Working Arrangements and Attitudes: Data. Available from:
https://wfhresearch.com/ (accessed 4 August 2026). |
| [4] | Aksoy, C. G., Barrero, J. M., Bloom, N., Davis, S. J., Dolls, M., Zarate, P. Working from Home Around the World. NBER Working Paper No. 30446. 2022.
https://doi.org/10.3386/w30446 |
[1-4]
.
2) Performance: structured hybrid work does not automatically reduce measured performance
| [11] | Bloom, N., Liang, J., Roberts, J., Ying, Z. J. Does Working from Home Work? Evidence from a Chinese Experiment. Quarterly Journal of Economics. 2015, 130(1), 165-218. https://doi.org/10.1093/qje/qju032 |
| [12] | Bloom, N., Han, R., Liang, J. Hybrid Working from Home Improves Retention Without Damaging Performance. Nature. 2024, 630, 920-925.
https://doi.org/10.1038/s41586-024-07500-2 |
[11, 12]
.
3) Retention: flexibility can reduce quits and preserve firm-specific human capital
.
4) Task contingency: benefits are more likely for independent, measurable work; costs are higher for tacit learning and intensive coordination
| [7] | Wang, B., Liu, Y., Qian, J., Parker, S. K. Achieving Effective Remote Working During the COVID-19 Pandemic: A Work Design Perspective. Applied Psychology. 2021, 70(1), 16-59. https://doi.org/10.1111/apps.12290 |
| [8] | Yang, L., Holtz, D., Jaffe, S., Suri, S., Sinha, S., Weston, J., Joyce, C., Shah, N., Sherman, K., Hecht, B., Teevan, J. The Effects of Remote Work on Collaboration Among Information Workers. Nature Human Behaviour. 2022, 6, 43-54.
https://doi.org/10.1038/s41562-021-01196-4 |
| [13] | Bao, L., Li, T., Xia, X., Zhu, K., Li, H., Yang, X. How Does Working from Home Affect Developer Productivity? A Case Study of Baidu During the COVID-19 Pandemic. Empirical Software Engineering. 2022, 27, Article 17.
https://doi.org/10.1007/s10664-021-10115-y |
[7, 8, 13]
.
5) Feasibility: the capacity to work from home differs sharply by occupation, education, sector, and digital infrastructure
| [4] | Aksoy, C. G., Barrero, J. M., Bloom, N., Davis, S. J., Dolls, M., Zarate, P. Working from Home Around the World. NBER Working Paper No. 30446. 2022.
https://doi.org/10.3386/w30446 |
| [9] | Dingel, J. I., Neiman, B. How Many Jobs Can Be Done at Home? Journal of Public Economics. 2020, 189, 104235. https://doi.org/10.1016/j.jpubeco.2020.104235 |
[4, 9]
.
6) Measurement: output-per-hour statistics do not fully capture commute savings, welfare, or avoided turnover costs.
3. Theoretical and Conceptual Framework
3.1. Theoretical Foundations
Socio-Technical Systems Theory
Socio-technical systems theory holds that performance depends on the joint design of social and technical systems
. Hybrid work changes both. The technical system includes cloud access, collaboration platforms, cybersecurity, project-management tools, and documentation standards. The social system includes trust, supervision, team norms, learning, leadership, and psychological safety. Flexibility without redesign may create fragmentation; aligned tools, decision rights, and communication routines can support autonomy and focus.
Job Demands-Resources Model
The job demands-resources model explains outcomes as the balance between demands and resources
. Hybrid work may reduce commuting, interruption, and schedule rigidity while increasing autonomy and work-life fit. It may also increase digital overload, social isolation, blurred boundaries, and coordination effort. Productivity should improve when added resources exceed added demands and when home-working conditions are adequate.
Transaction-Cost and Coordination Theory
Hybrid work lowers commuting and some facility costs but can increase communication, monitoring, and coordination costs. These costs are highest for tasks requiring rapid feedback, shared context, creative problem solving, mentoring, and tacit knowledge exchange. A hybrid system is therefore more likely to succeed when independent work is allocated to high-focus settings and coordination-intensive work is scheduled for purposeful interaction.
Human-Capital Retention and Labor-Market Matching
Lower quit rates reduce recruitment, vacancy, onboarding, and learning-curve costs. Hybrid policies can also expand applicant pools and labor-force participation among workers facing commuting, caregiving, disability, or location constraints. These benefits may not appear immediately in quarterly productivity indices, but they can improve longer-run organizational performance through continuity, matching, and accumulated knowledge
| [10] | Choudhury, P., Foroughi, C., Larson, B. Work-from-Anywhere: The Productivity Effects of Geographic Flexibility. Strategic Management Journal. 2021, 42(4), 655-683.
https://doi.org/10.1002/smj.3251 |
| [12] | Bloom, N., Han, R., Liang, J. Hybrid Working from Home Improves Retention Without Damaging Performance. Nature. 2024, 630, 920-925.
https://doi.org/10.1038/s41586-024-07500-2 |
[10, 12]
.
3.2. Conceptual Framework and Hypotheses
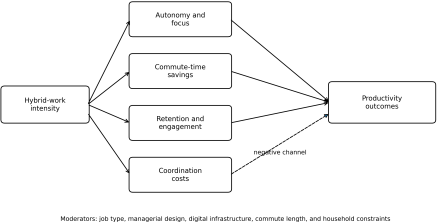
Figure 1. Conceptual framework linking hybrid-work intensity to productivity outcomes.
Figure 1 models hybrid-work intensity as an organizational input that affects productivity through autonomy and focus, commute-time savings, retention and engagement, and coordination costs. Job type, managerial design, digital infrastructure, commute length, and household constraints moderate the net effect.
Hypotheses
1) H1: Hybrid-work intensity is positively associated with productivity when tasks contain a substantial independent-work component.
2) H2: Autonomy and focus time mediate the relationship between hybrid-work intensity and productivity.
3) H3: Commute-time savings strengthen the positive effect of hybrid work on productivity and employee welfare.
4) H4: Coordination costs weaken the productivity relationship, especially for highly interdependent work.
5) H5: Hybrid work supports longer-run productivity through retention and engagement.
6) H6: Digital infrastructure and managerial design moderate the hybrid-work-productivity relationship.
7) H7: Aggregate productivity effects are harder to identify than firm- or employee-level effects because macro data contain simultaneous shocks.
8) H8: The post-stabilization relationship between changes in WFH intensity and productivity growth differs from the emergency-pandemic relationship.
H1-H6 are mechanism-based propositions that require firm- or worker-level data for direct testing. The aggregate analysis primarily evaluates persistence, H7, and the period difference expressed in H8.
4. Data and Variables
4.1. Data Sources and Sample
The study uses public secondary data only. WFH Research provides monthly survey-weighted estimates of the percentage of paid working days performed from home
| [3] | WFH Research. Survey of Working Arrangements and Attitudes: Data. Available from:
https://wfhresearch.com/ (accessed 4 August 2026). |
[3]
. Labor productivity is measured by the BLS nonfarm business output-per-hour index, while real GDP and unemployment are obtained through FRED
| [17] | U.S. Bureau of Labor Statistics. Labor Productivity and Costs. Available from: https://www.bls.gov/lpc/ (accessed 4 August 2026). |
| [18] | Federal Reserve Bank of St. Louis. FRED Economic Data: OPHNFB, GDPC1, and UNRATE. Available from:
https://fred.stlouisfed.org/ (accessed 4 August 2026). |
[17, 18]
. Monthly WFH and unemployment observations are aggregated to quarterly means. The estimation sample begins when the relevant quarterly variables overlap consistently and ends in 2026Q1 for regression analysis.
Table 1. Data sources and variable roles.
Variable group | Data source | Frequency | Measurement | Period used | Role |
WFH rate | WFH Research | Monthly | Percentage of paid working days performed from home | 2019-12 to 2026-06 | Main explanatory variable |
Labor productivity | FRED/BLS OPHNFB | Quarterly | Nonfarm business output per hour, 2017=100 | 2019Q4 to 2026Q1 | Dependent variable |
Real GDP | FRED/BEA GDPC1 | Quarterly | Billions of chained 2017 dollars, SAAR | 2019Q4 to 2026Q1 | Macroeconomic control |
Unemployment | FRED/BLS UNRATE | Monthly to quarterly mean | Percentage of labor force unemployed | 2019Q4 to 2026Q1 | Labor-market control |
Sectoral WFH | WFH Research | Annual | Percentage of paid working days by sector | 2022-2026 | Heterogeneity analysis |
4.2. Variable Definitions and Data Integrity
Table 2. Operational definitions of variables.
Variable | Definition | Construction |
WFH_RATE | Quarterly average percentage of paid working days performed from home | Mean of available monthly WFH observations |
PROD_INDEX | Nonfarm business labor productivity index | FRED series OPHNFB |
PROD_QOQ | Quarterly log change in productivity (%) | 100 x change in ln(PROD_INDEX) |
PROD_YOY | Year-over-year log change in productivity (%) | 100 x four-quarter change in ln(PROD_INDEX) |
GDP_QOQ | Quarterly log change in real GDP (%) | 100 x change in ln(GDPC1) |
GDP_YOY | Year-over-year log change in real GDP (%) | 100 x four-quarter change in ln(GDPC1) |
UNEMP | Quarterly average unemployment rate | Mean of monthly UNRATE |
D_WFH | Quarterly change in WFH rate | WFH_RATE(t) - WFH_RATE(t-1) |
POST_STABILIZATION | Indicator for 2022Q1 onward | 1 for quarter >= 2022Q1; otherwise 0 |
Data Integrity and Reproducibility
No observations or coefficients are simulated. Missing observations are not interpolated for estimation. The monthly WFH series begins with December 2019 and then resumes in May 2020; the quarterly models therefore use only periods with available overlapping variables. Data provenance, aggregation rules, variable formulas, and model specifications are stated in the manuscript. Because the analysis uses public aggregate data and no identifiable participant information, participant-level ethics approval is not required.
5. Methodology and Statistical Strategy
5.1. Analytical Strategy
The analysis proceeds in five stages: descriptive analysis of WFH persistence; graphical comparison of WFH and productivity; correlation analysis; exploratory OLS regression with HAC standard errors; and a post-stabilization model beginning in 2022Q1. GDP growth and unemployment are included because productivity varies with business-cycle and labor-market conditions. The models are not interpreted as causal because the sample is short and several structural shocks occurred during the study period.
5.2. Regression Specifications and Evaluation Criteria
The primary quarterly growth model is:
PROD_QOQ(t) = alpha + beta1 D_WFH(t) + beta2 UNEMP(t) + beta3 GDP_QOQ(t) + epsilon(t) (1)
The year-over-year robustness model is:
PROD_YOY(t) = alpha + beta1 WFH_RATE(t) + beta2 UNEMP(t) + beta3 GDP_YOY(t) + epsilon(t) (2)
Equation (
1) is estimated for the full common sample and for the post-stabilization period. Coefficient inference uses HAC standard errors with one lag and a normal approximation. Adjusted R-squared, the conventional OLS F-statistic and its probability, the number of observations, and the Durbin-Watson statistic are reported as requested. The Durbin-Watson values are diagnostic rather than substitutes for HAC inference.
Evaluation Criteria
1) Persistence: whether WFH remains materially above the pre-pandemic baseline.
2) Direction: whether WFH intensity and productivity move together in levels or changes.
3) Robustness: whether the association changes after emergency-pandemic quarters are excluded.
4) Interpretability: whether the results align with theory and stronger micro-level evidence.
5) Publication ethics: whether claims remain within the support of the data.
6. Empirical Results
6.1. Descriptive Trends and Statistics
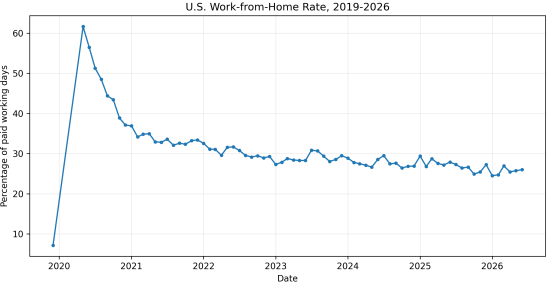
The WFH rate increased from 7.15% of paid working days in December 2019 to 61.64% in May 2020. It then declined as emergency restrictions eased and reached 25.98% in June 2026. The 2022-June 2026 average was 28.15%, indicating a stabilized hybrid-work regime well above the pre-pandemic benchmark.
Figure 2. Monthly U.S. work-from-home rate, 2019-2026.
Productivity Trend During the Hybrid-Work Period
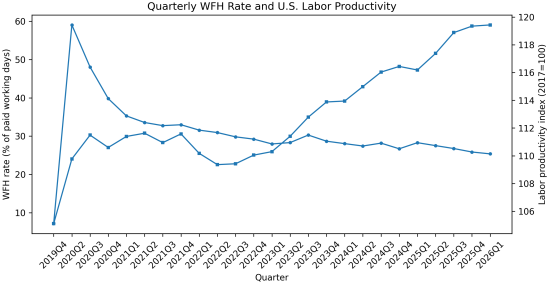
The nonfarm business labor productivity index rose from 105.103 in 2019Q4 to 119.437 in 2026Q1, a cumulative increase of 13.64%. The path was uneven: early-pandemic productivity was affected by disproportionate changes in output and hours, productivity softened in 2022, and growth resumed during 2023-2026.
Figure 3 illustrates why levels alone are difficult to interpret: WFH declined from an emergency peak while productivity generally rose.
Figure 3. Quarterly WFH rate and U.S. labor productivity index.
Descriptive Statistics
Table 3. Descriptive statistics for the quarterly estimation sample.
Variable | count | mean | std | min | 25% | 50% | 75% | max |
WFH_RATE | 24.000 | 31.773 | 7.642 | 25.377 | 27.858 | 28.958 | 32.808 | 59.050 |
PROD_INDEX | 24.000 | 113.227 | 3.317 | 109.360 | 110.524 | 111.602 | 116.073 | 119.437 |
PROD_QOQ | 24.000 | 0.550 | 1.147 | -1.264 | 0.058 | 0.479 | 0.974 | 4.751 |
PROD_YOY | 22.000 | 1.774 | 2.116 | -2.051 | 0.303 | 2.144 | 2.980 | 6.217 |
REAL_GDP | 24.000 | 22448.873 | 1269.990 | 19077.992 | 21853.990 | 22510.053 | 23495.980 | 24180.419 |
GDP_QOQ | 24.000 | 0.646 | 2.385 | -8.204 | 0.397 | 0.771 | 1.085 | 7.476 |
UNEMP | 24.000 | 4.859 | 2.143 | 3.533 | 3.758 | 4.150 | 4.604 | 13.000 |
The sample contains both emergency-pandemic and stabilized quarters. Quarterly WFH intensity ranges from 25.377% to 59.050%, while quarterly productivity growth ranges from -1.264% to 4.751%. This dispersion supports separate examination of the post-stabilization period.
6.2. Correlation, Regression, and Sectoral Evidence
Correlation Evidence
Table 4. Correlation matrix.
Variable | WFH_RATE | PROD_INDEX | PROD_QOQ | D_WFH | GDP_QOQ | UNEMP |
WFH_RATE | 1.000 | -0.499 | 0.594 | -0.851 | -0.280 | 0.948 |
PROD_INDEX | -0.499 | 1.000 | 0.035 | 0.270 | 0.074 | -0.249 |
PROD_QOQ | 0.594 | 0.035 | 1.000 | -0.026 | -0.432 | 0.673 |
D_WFH | -0.851 | 0.270 | -0.026 | 1.000 | -0.734 | -0.883 |
GDP_QOQ | -0.280 | 0.074 | -0.432 | -0.734 | 1.000 | -0.354 |
UNEMP | 0.948 | -0.249 | 0.673 | -0.883 | -0.354 | 1.000 |
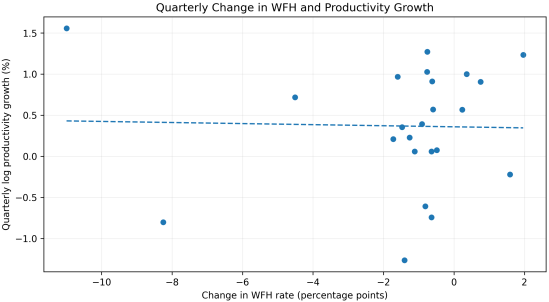
The level correlation between WFH_RATE and PROD_INDEX is -0.499, reflecting the decline of WFH from emergency levels while productivity rose later. The correlation between D_WFH and PROD_QOQ is -0.026, which is close to zero. These unconditional associations do not establish causality and motivate the controlled models.
Regression Results
Table 5. OLS estimates with HAC(1) coefficient inference and model diagnostics.
Variable/Statistic | M1: Level | M2: QoQ | M3: Stable QoQ | M4: YoY |
Constant | 136.884*** (2.691) | 0.929 (0.758) | -2.325*** (0.907) | 2.155 (1.940) |
WFH_RATE | -1.259*** (0.123) | - | - | -0.304** (0.131) |
D_WFH | - | 0.085 (0.070) | 0.119** (0.054) | - |
UNEMP | 3.253*** (0.671) | -0.286 (0.187) | 0.499** (0.215) | 2.185*** (0.637) |
GDP_QOQ | 0.073 (0.742) | 0.954*** (0.208) | 1.475*** (0.155) | - |
GDP_YOY | - | - | - | -0.241*** (0.081) |
R-squared | 0.797 | 0.505 | 0.822 | 0.484 |
Adjusted R-squared | 0.763 | 0.423 | 0.781 | 0.398 |
F-statistic | 23.589 | 6.127 | 20.035 | 5.635 |
Prob > F | 0.000002 | 0.004660 | 0.000037 | 0.006647 |
Observations | 22 | 22 | 17 | 22 |
Durbin-Watson | 1.239 | 0.837 | 2.084 | 0.854 |
Model 1 produces a negative WFH level coefficient, but the specification is dominated by the pandemic timing pattern and is not interpreted causally. In Model 2, D_WFH is positive but statistically insignificant, while GDP_QOQ is positive and significant. Thus, full-sample quarterly productivity changes are more strongly associated with macroeconomic recovery than with WFH changes alone.
Model 3 begins in 2022Q1. D_WFH is positive and significant using HAC normal inference (coefficient 0.119; p=0.028). The estimate is consistent with a more favorable post-stabilization association, but only 17 quarters are available. Model 4 again produces a negative WFH level coefficient, which is likely influenced by normalization from emergency WFH levels. The Durbin-Watson statistics indicate residual persistence in several full-sample specifications; HAC inference and cautious interpretation are therefore essential.
Figure 4. Quarterly change in the WFH rate and quarterly productivity growth.
Sectoral Heterogeneity
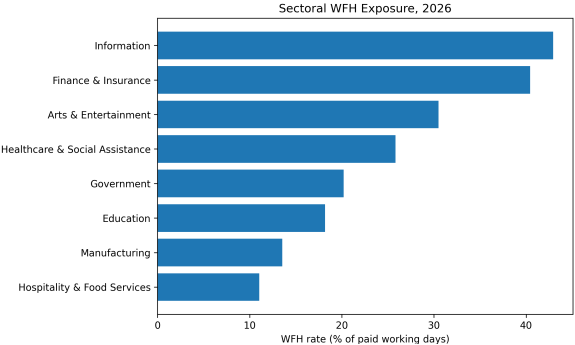
WFH exposure differs substantially across sectors. In 2026, Information recorded 42.93% of paid working days from home, compared with 11.03% in Hospitality and Food Services. Differences in task digitizability, customer contact, physical production, and coordination intensity limit the usefulness of a single economy-wide hybrid rule.
Figure 5. Sectoral WFH exposure in 2026.
Table 6. Selected sectoral WFH rates, 2022-2026.
sector | 2022 | 2023 | 2024 | 2025 | 2026 |
Arts & Entertainment | 34.980 | 35.570 | 32.510 | 34.190 | 30.500 |
Education | 24.350 | 21.600 | 19.450 | 18.140 | 18.190 |
Finance & Insurance | 44.760 | 43.090 | 44.940 | 44.490 | 40.430 |
Government | 26.900 | 24.080 | 26.840 | 23.950 | 20.200 |
Healthcare & Social Assistance | 26.040 | 25.240 | 25.730 | 25.480 | 25.820 |
Hospitality & Food Services | 11.760 | 11.200 | 10.230 | 11.110 | 11.030 |
Information | 48.450 | 45.390 | 44.740 | 42.440 | 42.930 |
Manufacturing | 17.490 | 16.170 | 16.150 | 14.570 | 13.540 |
7. Discussion
7.1. Interpretation of the Macro Evidence
The results support a nuanced conclusion. WFH has clearly persisted, but aggregate productivity does not exhibit a simple one-directional relationship with hybrid-work intensity. This is consistent with the conceptual framework: autonomy, focus, commute savings, and retention may improve performance, while coordination, mentoring, and communication costs may offset those gains.
The most robust descriptive result is the new equilibrium. By mid-2026, WFH remained more than three times its December 2019 benchmark. This persistence suggests durable investments in home offices, collaboration tools, and managerial routines. The managerial question is therefore how to govern hybrid work, rather than whether the economy will fully return to pre-2020 arrangements.
The post-stabilization estimate is informative but preliminary. After 2022, quarterly WFH changes are positively associated with productivity growth after GDP and unemployment controls. The coefficient does not prove causality, and its significance depends on the chosen inference convention and short sample. It nevertheless supports the proposition that designed hybrid work may operate differently from emergency remote work.
7.2. Comparison with Causal and International Evidence
The aggregate findings align with causal evidence showing that structured hybrid work can preserve performance and improve retention
. They are also compatible with the earlier call-center experiment, which found gains where output was individual and measurable
| [11] | Bloom, N., Liang, J., Roberts, J., Ying, Z. J. Does Working from Home Work? Evidence from a Chinese Experiment. Quarterly Journal of Economics. 2015, 130(1), 165-218. https://doi.org/10.1093/qje/qju032 |
[11]
. At the same time, evidence of more siloed collaboration under remote work explains why the same arrangement may be less effective for mentoring, innovation, and complex interdependent projects
| [8] | Yang, L., Holtz, D., Jaffe, S., Suri, S., Sinha, S., Weston, J., Joyce, C., Shah, N., Sherman, K., Hecht, B., Teevan, J. The Effects of Remote Work on Collaboration Among Information Workers. Nature Human Behaviour. 2022, 6, 43-54.
https://doi.org/10.1038/s41562-021-01196-4 |
[8]
.
International variation reinforces the contingency argument. WFH is more feasible where occupations are digitally portable and where workers, firms, and infrastructure can support remote coordination
| [4] | Aksoy, C. G., Barrero, J. M., Bloom, N., Davis, S. J., Dolls, M., Zarate, P. Working from Home Around the World. NBER Working Paper No. 30446. 2022.
https://doi.org/10.3386/w30446 |
| [9] | Dingel, J. I., Neiman, B. How Many Jobs Can Be Done at Home? Journal of Public Economics. 2020, 189, 104235. https://doi.org/10.1016/j.jpubeco.2020.104235 |
[4, 9]
. The U.S. results should therefore not be generalized mechanically to lower-connectivity labor markets or sectors dominated by physical and customer-facing work.
8. Theoretical, Managerial, and Policy Implications
8.1. Theoretical Implications
The study supports a contingent productivity-system view. Hybrid work is not a single treatment; it is a bundle of spatial flexibility, schedule discretion, technology, managerial control, and coordination practices. The net effect depends on complementarities among those elements. The macro evidence also illustrates a cross-level measurement problem: retention and commute gains may be economically important even when they are not separately visible in an aggregate output-per-hour index.
8.2. Managerial and Policy Implications
1) Segment tasks: reserve home time for concentration-intensive work and office time for mentoring, coordination, and decisions.
2) Use purposeful anchor days rather than requiring attendance without a collaboration objective.
3) Document decisions and workflows so that access to information does not depend on physical presence.
4) Train managers in remote coaching, trust, inclusion, conflict management, and output-based evaluation.
5) Monitor performance, quality, cycle time, turnover, absenteeism, and employee experience rather than office visibility alone.
6) Audit promotion, assignments, and recognition for proximity bias.
7) Provide secure systems, reliable access, and clear communication norms.
Policy Implications
Public policy can support productive hybrid work through broadband, cybersecurity capability, digital skills, accessible labor regulation, and management training. Flexible work can widen participation for caregivers, persons with disabilities, and workers outside major urban centers. Transport and urban policy should also recognize that persistent hybrid work changes commuting patterns and local demand. However, policy should not assume that every occupation can be performed remotely; sector and task differences remain fundamental
.
9. Robustness, Validity, and Limitations
9.1. Robustness and Validity
The study uses public, traceable data; avoids interpolation of missing WFH observations; reports HAC standard errors; separates emergency and post-stabilization periods; and triangulates aggregate findings with experimental and organizational evidence. Reporting adjusted R-squared, F-statistics, Prob > F, observations, and Durbin-Watson statistics improves diagnostic transparency.
9.2. Limitations and Future Research
The first limitation is sample size. Quarterly data provide few degrees of freedom, especially after 2022. Results are sensitive to specification, period choice, and inference method. Second, aggregation combines sectors with very different WFH feasibility. Third, WFH_RATE measures location intensity rather than the quality of hybrid-work design. Fourth, omitted factors such as technology investment, capital intensity, labor reallocation, and management quality may influence both productivity and WFH. Finally, Durbin-Watson values below two in several models indicate residual persistence despite HAC correction.
Future Research
1) Estimate firm-level panels using output, sales, project completion, absence, and turnover measures.
2) Use randomized policy assignments or difference-in-differences designs around hybrid-policy changes.
3) Measure commute savings, employee welfare, retention costs, mentoring, promotion, and wage progression.
4) Combine occupation-level WFH feasibility with sector productivity and digital-infrastructure measures.
5) Compare advanced and developing economies to test institutional boundary conditions.
10. Conclusion
Hybrid work is a defining organizational change of the post-COVID economy. U.S. WFH intensity remains far above its pre-pandemic baseline, while nonfarm business labor productivity increased materially over the broad study period. The aggregate relationship is complex: level specifications are distorted by emergency-pandemic timing, the full-sample quarterly change estimate is not statistically significant, and the post-stabilization model shows a positive association after controls.
These results should not be interpreted as causal proof. The most defensible conclusion is that hybrid work can be compatible with productivity when organizations align work location with task type, coordination needs, digital infrastructure, managerial capability, and employee wellbeing. Hybrid work is neither universally superior nor inherently harmful; it is a contingent productivity system whose value depends on design.
Abbreviations
BLS | U.S. Bureau of Labor Statistics |
FRED | Federal Reserve Economic Data |
GDP | Gross Domestic Product |
HAC | Heteroskedasticity- and Autocorrelation-Consistent |
OLS | Ordinary Least Squares |
WFH | Work-from-Home |
Author Contributions
Sarfaraz Abu Abdullah: Conceptualization, Data curation, Formal Analysis, Investigation, Methodology, Resources, Visualization, Writing – original draft, Writing – review & editing
Conflicts of Interest
The author declares no conflicts of interest.
References
| [1] |
Barrero, J. M., Bloom, N., Davis, S. J. The Evolution of Work from Home. Journal of Economic Perspectives. 2023, 37(4),
23-50.
https://doi.org/10.1257/jep.37.4.23
|
| [2] |
Bick, A., Blandin, A., Mertens, K. Work from Home Before and After the COVID-19 Outbreak. American Economic Journal: Macroeconomics. 2023, 15(4), 1-39.
https://doi.org/10.1257/mac.20210061
|
| [3] |
WFH Research. Survey of Working Arrangements and Attitudes: Data. Available from:
https://wfhresearch.com/
(accessed 4 August 2026).
|
| [4] |
Aksoy, C. G., Barrero, J. M., Bloom, N., Davis, S. J., Dolls, M., Zarate, P. Working from Home Around the World. NBER Working Paper No. 30446. 2022.
https://doi.org/10.3386/w30446
|
| [5] |
Allen, T. D., Golden, T. D., Shockley, K. M. How Effective Is Telecommuting? Assessing the Status of Our Scientific Findings. Psychological Science in the Public Interest. 2015, 16(2), 40-68.
https://doi.org/10.1177/1529100615593273
|
| [6] |
Gajendran, R. S., Harrison, D. A. The Good, the Bad, and the Unknown About Telecommuting: Meta-Analysis of Psychological Mediators and Individual Consequences. Journal of Applied Psychology. 2007, 92(6), 1524-1541.
https://doi.org/10.1037/0021-9010.92.6.1524
|
| [7] |
Wang, B., Liu, Y., Qian, J., Parker, S. K. Achieving Effective Remote Working During the COVID-19 Pandemic: A Work Design Perspective. Applied Psychology. 2021, 70(1), 16-59.
https://doi.org/10.1111/apps.12290
|
| [8] |
Yang, L., Holtz, D., Jaffe, S., Suri, S., Sinha, S., Weston, J., Joyce, C., Shah, N., Sherman, K., Hecht, B., Teevan, J. The Effects of Remote Work on Collaboration Among Information Workers. Nature Human Behaviour. 2022, 6, 43-54.
https://doi.org/10.1038/s41562-021-01196-4
|
| [9] |
Dingel, J. I., Neiman, B. How Many Jobs Can Be Done at Home? Journal of Public Economics. 2020, 189, 104235.
https://doi.org/10.1016/j.jpubeco.2020.104235
|
| [10] |
Choudhury, P., Foroughi, C., Larson, B. Work-from-Anywhere: The Productivity Effects of Geographic Flexibility. Strategic Management Journal. 2021, 42(4), 655-683.
https://doi.org/10.1002/smj.3251
|
| [11] |
Bloom, N., Liang, J., Roberts, J., Ying, Z. J. Does Working from Home Work? Evidence from a Chinese Experiment. Quarterly Journal of Economics. 2015, 130(1), 165-218.
https://doi.org/10.1093/qje/qju032
|
| [12] |
Bloom, N., Han, R., Liang, J. Hybrid Working from Home Improves Retention Without Damaging Performance. Nature. 2024, 630, 920-925.
https://doi.org/10.1038/s41586-024-07500-2
|
| [13] |
Bao, L., Li, T., Xia, X., Zhu, K., Li, H., Yang, X. How Does Working from Home Affect Developer Productivity? A Case Study of Baidu During the COVID-19 Pandemic. Empirical Software Engineering. 2022, 27, Article 17.
https://doi.org/10.1007/s10664-021-10115-y
|
| [14] |
Bakker, A. B., Demerouti, E. The Job Demands-Resources Model: State of the Art. Journal of Managerial Psychology. 2007, 22(3), 309-328.
https://doi.org/10.1108/02683940710733115
|
| [15] |
Trist, E. L., Bamforth, K. W. Some Social and Psychological Consequences of the Longwall Method of Coal-Getting. Human Relations. 1951, 4(1), 3-38.
https://doi.org/10.1177/001872675100400101
|
| [16] |
Organisation for Economic Co-operation and Development. Productivity Gains from Teleworking in the Post COVID-19 Era: How Can Public Policies Make It Happen? Paris: OECD; 2020.
https://doi.org/10.1787/a5d52e99-en
|
| [17] |
U.S. Bureau of Labor Statistics. Labor Productivity and Costs. Available from:
https://www.bls.gov/lpc/
(accessed 4 August 2026).
|
| [18] |
Federal Reserve Bank of St. Louis. FRED Economic Data: OPHNFB, GDPC1, and UNRATE. Available from:
https://fred.stlouisfed.org/
(accessed 4 August 2026).
|
Cite This Article
-
-
@article{10.11648/j.iecon.20260104.13,
  author = {Sarfaraz Abu Abdullah},
  title = {Hybrid Work and U.S. Labor Productivity After COVID-19: Evidence from Public Data, 2019-2026},
  journal = {Innovation Economics},
  volume = {1},
  number = {4},
  pages = {163-174},
  doi = {10.11648/j.iecon.20260104.13},
  url = {https://doi.org/10.11648/j.iecon.20260104.13},
  eprint = {https://article.sciencepublishinggroup.com/pdf/10.11648.j.iecon.20260104.13},
  abstract = {Hybrid work has become a durable feature of post-pandemic labor markets, yet its productivity implications remain contested. This study examines the association between work-from-home (WFH) intensity and U.S. nonfarm business labor productivity using public data from WFH Research and the Federal Reserve Economic Data database. Monthly WFH rates are aggregated to quarterly means and combined with quarterly productivity, real gross domestic product, and unemployment data for 2019-2026. The analysis applies descriptive statistics, correlation analysis, ordinary least squares models with heteroskedasticity- and autocorrelation-consistent standard errors, and a post-stabilization subsample beginning in 2022Q1. The WFH share rose from 7.15% of paid working days in December 2019 to 61.64% in May 2020 and then stabilized at 25.98% in June 2026. Over the broad study period, the productivity index increased by 13.64%. The full-sample change model shows no statistically significant independent WFH association, whereas the post-stabilization model reports a positive coefficient for quarterly WFH changes (0.119; p=0.028 using HAC normal inference). Because the sample is small and aggregate data contain structural shocks, the results are associational rather than causal. The evidence supports a contingent view in which productivity depends on task type, coordination design, digital infrastructure, autonomy, commute savings, and retention.},
 year = {2026}
}
 Copy
|
 Download
-
TY  - JOUR
T1  - Hybrid Work and U.S. Labor Productivity After COVID-19: Evidence from Public Data, 2019-2026
AU  - Sarfaraz Abu Abdullah
Y1  - 2026/10/20
PY  - 2026
N1  - https://doi.org/10.11648/j.iecon.20260104.13
DO  - 10.11648/j.iecon.20260104.13
T2  - Innovation Economics
JF  - Innovation Economics
JO  - Innovation Economics
SP  - 163
EP  - 174
PB  - Science Publishing Group
SN  - 3071-4931
UR  - https://doi.org/10.11648/j.iecon.20260104.13
AB  - Hybrid work has become a durable feature of post-pandemic labor markets, yet its productivity implications remain contested. This study examines the association between work-from-home (WFH) intensity and U.S. nonfarm business labor productivity using public data from WFH Research and the Federal Reserve Economic Data database. Monthly WFH rates are aggregated to quarterly means and combined with quarterly productivity, real gross domestic product, and unemployment data for 2019-2026. The analysis applies descriptive statistics, correlation analysis, ordinary least squares models with heteroskedasticity- and autocorrelation-consistent standard errors, and a post-stabilization subsample beginning in 2022Q1. The WFH share rose from 7.15% of paid working days in December 2019 to 61.64% in May 2020 and then stabilized at 25.98% in June 2026. Over the broad study period, the productivity index increased by 13.64%. The full-sample change model shows no statistically significant independent WFH association, whereas the post-stabilization model reports a positive coefficient for quarterly WFH changes (0.119; p=0.028 using HAC normal inference). Because the sample is small and aggregate data contain structural shocks, the results are associational rather than causal. The evidence supports a contingent view in which productivity depends on task type, coordination design, digital infrastructure, autonomy, commute savings, and retention.
VL  - 1
IS  - 4
ER  -
Copy
|
Download





 Share This Article
 Twitter
 Linked In
 Facebook
